In Texas private passenger auto, market share isn’t being won by who files the biggest rate changes, it’s being won by the carriers who can re-price with the most precision and get it into market fastest. That dynamic is now visible in the data.
This report analyzes five years of market share data (2020–2024) and regulatory filing activity from SERFF to understand who is winning, who is losing, and and what the filing record suggests about the pricing behaviors driving those outcomes..
Over the past five years, two carriers have pulled ahead, Progressive and State Farm. Filing evidence suggests the reason for this could be the speed and precision with which they adapted their pricing strategies.
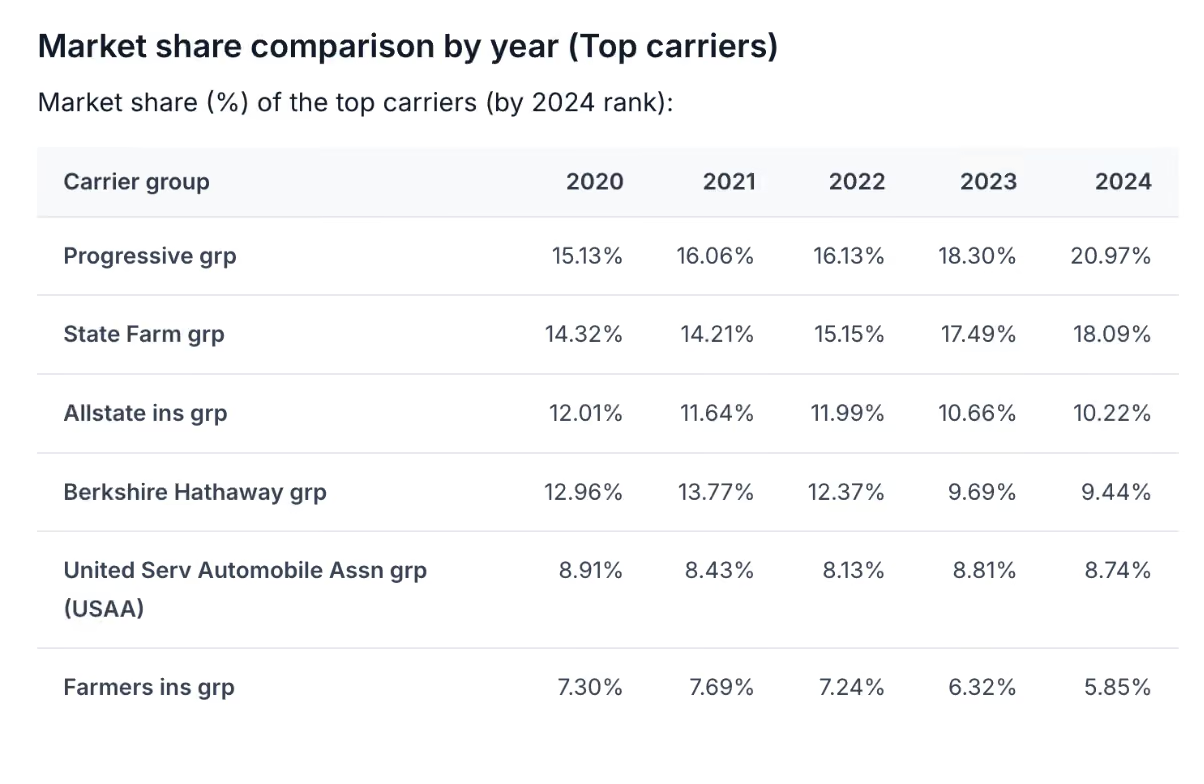
Table depicting Market Share (%) of the top carriers, retrieved from Akur8 Discover, sourced from NAIC Property/Casualty Annual Statement
Market leadership is consolidated around two clear winners
The Texas PPA market has seen a meaningful shift in concentration over the last five years. The top two carriers by market share have grown their combined position significantly, while the rest of the top 5 have generally lost ground.
Market concentration increased slightly at the top. The Top 5 carriers went from 63.35% (2020) to 67.45% (2024), but this growth is not evenly distributed.
The #1 carrier gained +5.84 pts of market share (2020→2024), including nearly 2.7 pts in a single year (2023→2024). This is a significant shift in a market this large.
The #2 carrier also grew, gaining +3.77 pts over the same period.
The remaining top-5 carriers have generally lost share, with declines ranging from −1.45 to −3.52 pts.
MGAs analysis:
We can not get a true market share report in Texas for MGAs, because market share is reported by insurer / insurer group and not by distribution entity (MGA). What we can do from SERFF is (a) identify which insurers are explicitly writing Texas PPA via MGA/program structures, and then (b) use those insurers’ group market shares as a proxy for “MGA-distributed” share.
Measured at the insurer-group level (proxy), MGA-distributed share appears to have increased from 2020 to 2023, then was roughly flat/slightly down in 2024. In the top-10-group market-share view, the combined share of the two most clearly MGA/program-driven groups moved from ~1.62% (2020) to ~5.24% (2023) and ~5.18% (2024).
Filing Evidence Points to Precision + Speed
SERFF filings offer hypotheses for why specific carriers attained market leadership during this time period. With that said, filing evidence only provides descriptive evidence as these markets are dynamic with many moving pieces.
Keeping this in mind, the evidence points to a consistent pattern: the winners combined speed with precision. Neither alone was sufficient.
TX Personal Auto has consistently heavy SERFF rate-filing volume in this 2020–2024 window, with an estimated 500-800 rate/rule filings annually between 2020 and 2024. Much of the “velocity” is driven by program-style writers that run many distinct programs (and therefore file many small updates) rather than a single monolithic program.
Large national writers tend to have fewer but “bigger” filings (base rate + major factor suites), while non-standard program managers / county mutual platforms tend to have many more, smaller, program-specific filings (often with frequent effective dates).
What you typically see in TX Personal Auto is:
Large carriers: lower filings per premium, but each filing can be operationally significant.
Smaller/program carriers: higher filings per premium because they manage many distinct programs/MGAs and tune them more frequently.
The #1 Carrier: Ahead of the Curve, Deployed Immediately
The filing record of the #1 carrier by market share reveals two consistent traits across the entire period.
Precision: In April 2021, before the worst of the 2022 inflation shock, this carrier added new rating variables explicitly described as "predictive of loss costs," improving segmentation before the market forced its hand. In 2023, they updated Kia/Hyundai symbol factors specifically in response to an emerging theft wave, demonstrating the ability to react to current loss drivers with surgical precision. In 2024, they added new rating variables with no overall rate change, effectively re-pricing the mix without moving the statewide average, attracting better risks while pricing adequately for worse ones.
Speed: The time between initial submission and requested new business effective date offers a window into operational execution. In Texas PPA, the market median is approximately 7 days and multiple filings from the #1 carrier shows effective dates the same day or the day after submission. It is important to note, however, that this metric captures only the final stage of the pricing cycle.
The #2 Carrier: Model Investment, but Slower Rate Action
The filing approach of the second-largest carrier shows deliberate investment in model quality and dislocation management. Filings from this period reflect methodology updates that kept pricing aligned with expected costs without disrupting the book, explicit location factor movement constraints (glidepaths) to moderate renewal disruption while correcting adequacy, and more recently a new model-based vehicle rating program using external data sources, a modern segmentation move that shifts competitiveness without changing the overall rate level.
These are meaningful investments, but filing evidence suggests that this carrier's rate level response during the inflationary period was slower than the market leader's, a pattern that the market data at the end of this section confirms.
The Contrast: Reactive and Late
In contrast, at least one major top-5 carrier's filing record tells a different story. A 2022 filing explicitly cited external inflation indicators, used vehicle values up +57% and CPI at ~9% YoY, as drivers of a major corrective rate action. This is the clearest "inflation shock" narrative in the sampled SERFF set.
This is what a late, large corrective action looks like: waiting until the data forces your hand, then making a big, abrupt move. When corrections are large and sudden rather than gradual and targeted, competitive positioning shifts, customers facing sharp price increases buy elsewhere, and carriers better positioned on adequacy capture that demand.
The Same Pattern Holds Among Smaller Carriers
Among the smaller carriers in the Top 10, the two that gained share in 2023–2024 also show fast filing execution, with new business effective dates requested within 1 to 3 days of submission.
An important caveat: speed alone does not guarantee share gains. At least one carrier filed with near-immediate new business timing yet saw overall share decline, illustrating that fast deployment only creates value when combined with the right underlying pricing.
What is more notable at the smaller carrier level is the growth of MGA and program-driven insurers. Using SERFF to identify carriers writing Texas PPA via MGA/program structures, their combined proxy market share grew from approximately 1.62% (2020) to 5.18% (2024). These carriers tend to submit many smaller, targeted filings rather than a few large ones, reflecting a more agile approach to pricing that may be contributing to their growth.
(Note: this is a proxy estimate based on the top 10 carrier groups; total MGA activity is likely higher.)
Growth without Profitability is not a Win
Market performance data from Discover puts these filing patterns in a broader context. The chart below plots inflation-adjusted premium growth against margin improvement for the top carriers in Texas PPA between 2019 and 2024. The negative trend line reflects a well-known industry dynamic: growth tends to come at the cost of profitability.
Market share comparison by year - powered by Akur8 Discover
Carrier #1, the market share leader, is the clear exception. With 94.5% premium growth and a loss ratio that remained virtually flat, moving from 61.87% to 61.32%, it is the only large carrier that broke the tradeoff. Growing aggressively while maintaining pricing adequacy is precisely what early segmentation investment and fast rate deployment make possible: staying close to the right price, for the right risks, at all times.
Carrier #2’s result illustrates the opposite. Despite strong premium growth (+59.9%), its loss ratio deteriorated from 64.08% to 73.91%, the worst outcome among the top 10 carriers. A carrier that is slower to take rate during a period of rapid cost increases will grow its competitive position, because its prices are relatively lower, but it will do so while losing money on the policies it writes. Growth of this kind carries significant risk and typically requires subsequent corrective rate actions that can disrupt retention.
Carrier #7, a notable mid-tier performer, achieved 27.3% premium growth while improving its loss ratio by 5.63 points, slightly above the trend line, suggesting a more favorable growth-profitability outcome than most peers at a similar growth level.
Taken together, the data confirms what the filing evidence suggests: speed and precision in pricing are not just operational metrics. They determine whether growth is sustainable and that distinction starts long before a filing is submitted.
The Real Bottleneck: The Pricing Execution Cycle
The filing evidence points to a clear competitive dynamic, but it also surfaces a broader industry challenge.
For most carriers, the journey from identifying a needed pricing change to seeing it reflected in live quotes is long and fragmented.
Competitive and regulatory research is manual and time-consuming, reviewing hundreds of SERFF filings, extracting rate tables, monitoring competitor moves.
Modeling requires iterative actuarial work that can take weeks or months.
Rate-making and rate structure design involves scenario testing, business review, and sign-off processes.
Filing preparation requires documentation, exhibits, and regulatory justifications that need to anticipate DOI objections.
Production deployment involves IT handoffs, testing, and version management that can add additional weeks.
Each of these steps introduces delay. And in a market where a carrier can go from submission to live rates in one day, that delay is a competitive disadvantage.
Akur8 Enables True End-to-End Pricing Agility
Akur8 was built to address every step of this cycle, as an end-to-end platform that connects market intelligence, rating, and production deployment.
Before changing a rate, you need to understand what competitors are doing, what regulators are flagging, and what variables are gaining traction in the market. With Akur8 Discover you can use AI and LLMs to extract structured insights from SERFF filings at scale, benchmarking rating plans against market practices, surfacing emerging variables, and identifying regulatory precedents that accelerate filing approval and reduce objections. What used to take weeks of manual research can happen in hours.
At the core of any competitive pricing strategy is the rating process itself. Achieving the level of segmentation precision that allows carriers to refine pricing at the risk level, rather than applying uniform rate adjustments across the portfolio, requires powerful modeling capabilities. Akur8 Risk and Demand automate the tedious components of modeling with transparent AI, enriching models with geographic information, external data, and automated interactions while maintaining full actuarial control. Rate, a module with Akur8 pricing,then enables rapid scenario testing, portfolio and dislocation analysis, and rate structure design, so actuaries can iterate quickly and test the impact of changes before committing.
Once rates are finalized, Rate Repo provides the centralized source of truth for both pricing and implementation teams: it stores and manages Rate Order of Calculation (ROC) documentation and versions, runs ROC analyses at policy or portfolio level, and exports filing artifacts ready for deployment, directly streamlining the US regulatory filing process.
The final and often most significant bottleneck is production deployment. Even with great models and well-designed rates, getting pricing logic into production typically requires lengthy IT handoffs, manual testing, and version management. Akur8 Deploy operationalizes the entire process, enabling controlled, auditable promotion of approved pricing logic from Rate directly to a production API, with immutable version control, role-based access, and real-time premium calculation at sub-200ms latency. What used to take months can happen in days. The result: a complete pricing cycle that keeps pace with the market.
The Texas data shows that pricing agility is a key driver of market share. Carriers that can see what is happening in the market, model it precisely, and deploy it quickly are the ones pulling ahead. Akur8 makes that cycle possible, end-to-end, in one platform.
Download our white paper: ""
Download our webinar replay: ""
About the author
Andrew Whitney, Head of Applied AI Lab, Akur8
Drew Whitney leads Akur8’s Applied AI Lab, partnering with chief actuaries and product leaders to turn GenAI into production-grade workflows across filings, pricing, and market intelligence. As co-founder of Matrisk, he helped shape the emerging “filing AI” category, working with carriers and consulting firms to transform regulatory filings into a strategic data asset rather than a compliance chore. Drew comes from an enterprise IT and software background in complex, highly regulated environments, giving him a pragmatic perspective on how to deploy advanced AI in ways that are explainable, governed, and tied to measurable business outcomes.